Starting The Membrane Router Web Console
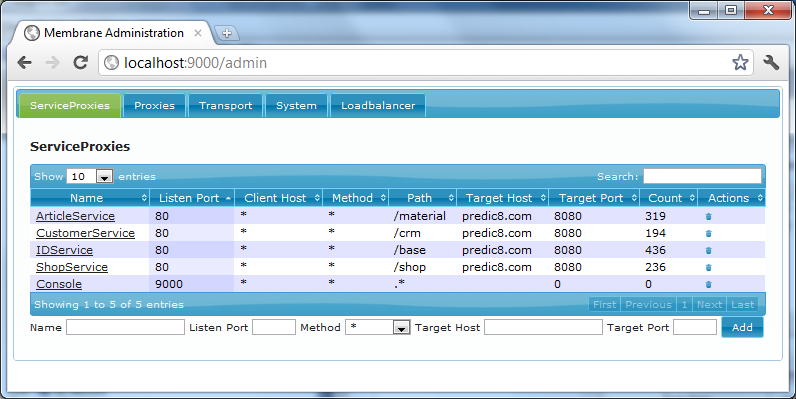
Want to know what your router is doing? Get usage statistics and information about deployed service proxies by logging onto the Web console. The console shows registered service proxies and proxies with their configured interceptors. In addition, creating and deleting proxies can be achieved easily with the web interface.

Figure1:
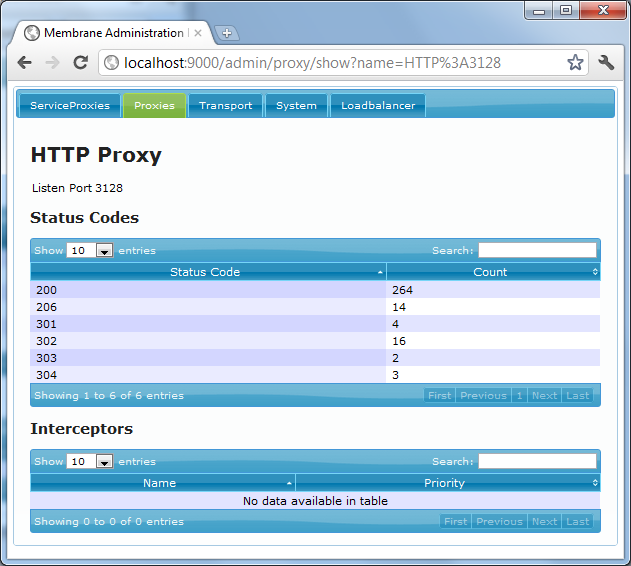
Detailed statistics can be found by following the links: The number of requests is broken down into status codes on the sub-pages.

Figure2:
In addition the console gives you information about the system and the interceptors that are engaged with the transport. Finally the Web console gives you an easy way to configure clusters for the load balancing feature.
Starting the Web Console
The default configuration of the Router and Monitor already includes an installed Web Console. You can open the Web console from your local machine with the following URL:
http://localhost:9000/admin
Login with username admin and password membrane
Installing the Web console
To install a Web console, simply add an adminConsole element to a serviceProxy. Then you can open the Web console with the following URL:
http://localhost:[Listening port of the serviceProxy]/admin
Securing the Web Console
Access to the console is limited by default to the local machine. Security is provided by the basicAuthentication and accessControl interceptors.