Manage and Monitor Membrane with JMX
Java Management Extensions, short JMX, extend Java with means of managing and monitoring Java applications and already has default options enabled to manipulate applications.
Membrane exposes additional functionality through JMX. You can activate and deactivate service proxies, check their current status and see how many exchanges they have processed.
Enable JMX in Membrane
The additional JMX features are easily enabled in any Membrane Service Proxy deployment.
- Open $MEMBRANE_HOME/conf/proxies.xml
- Add the jmxExporter bean as first entry in the configuration file
Example Configuration
This is an example on how a JMX configuration is done
    <jmxExporter/>
	<router jmx="Membrane Router">

		<serviceProxy name="Fruit Shop" port="2000">
			<path>/shop</path>
			<target host="api.predic8.de" port="443">
				<ssl ignoreTimestampCheckFailure="true" />
			</target>
		</serviceProxy>

	</router>
Display JMX Functionality with JConsole
JConsole provides means to use JMX functionality through a graphical user interface. It comes as part of the Java Development Kit.
Start JConsole and find your application, then connect to it. Click on the MBeans tab. Here you will see the default JMX functionality and also functionality provided by Membrane, the org.membrane-soa MBean.
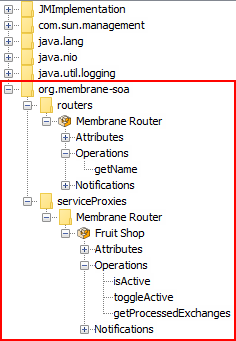
Figure1:
In the org.membrane-soa MBean you will find all routers and all service proxies of those routers that the monitored Membrane instance has. As mentioned earlier you can activate and deactivate service proxies, check their current status and see how many exchanges they have processed.
Help needed?
Do you need any help? Then contact us using the Membrane Google Group or send an email to membrane@predic8.com.